
December 17, 2012
Housing Bubble?
Thomas Holloway, CFA
Fixed Income Analyst
In the 1964 Bond movie Goldfinger, “M” asks the hero: “What do you know about gold?” Bond replies with a wry smile, “I know it when I see it”.
What do we know about a housing bubble? Do we know it when we see it? Typically, households will over-own, developers will over-build, banks will over-lend, government will be over-involved, and the economy will be over-dependent. Parts of the Canadian housing market display each of these aspects. As value investors we’re keenly on the lookout for overvaluation. Why the real estate market? Because it is an important factor in the economy and can have a large, indirect impact on other asset prices.
We looked at forty years of housing fundamentals in twenty-one OECD countries to see how house prices interacted with inflation, household incomes and rents. Over the sample period 1970-2012, prices really do go up most of the time, just like your dad and your realtor always say. However, in the long run, prices go up because incomes and rents go up, mostly due to inflation. Looking at the ratio of house prices-to-rent or house prices-to-income highlights the cyclical nature of real estate.
To help make sense of all the data, we identified 48 distinct peaks in national price-to-income such as 1978 Norway, 1989 Great Britain, and of course, 2005 United States (prices kept going up for a while, but price-to-income peaked at the end of 2005). Instead of concentrating only on the recent US debacle, we’re looking at more history and more countries. The chart shows the results.
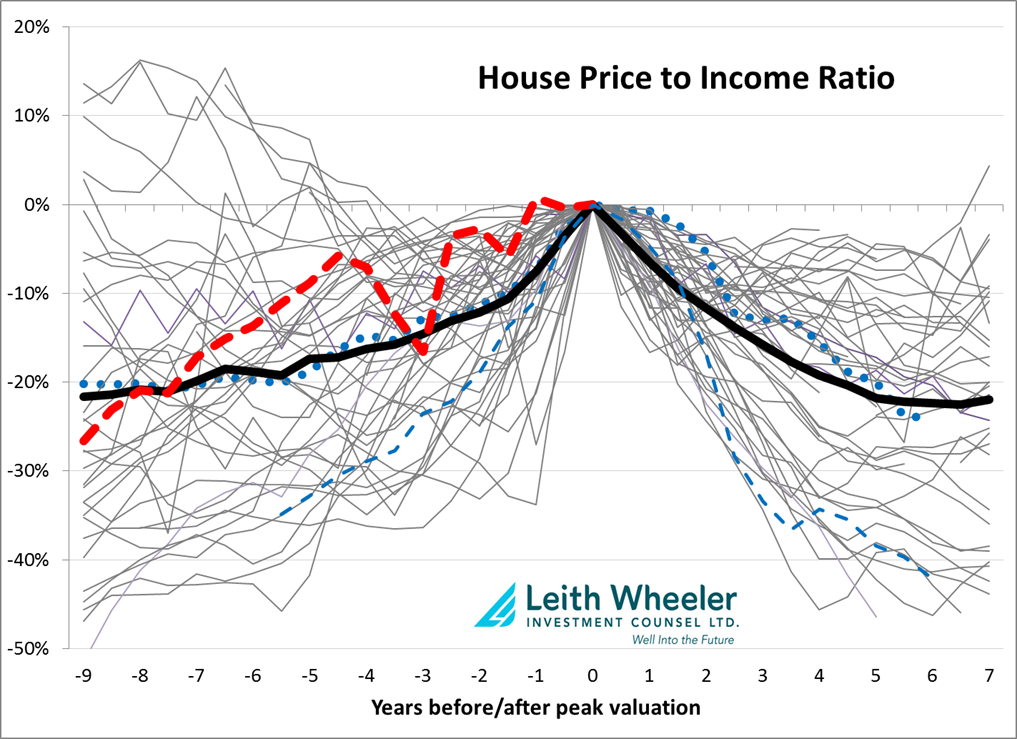
Remember, this chart plots changes in house price-to-income ratio, not just prices. The bold line is the average over all 48 cycles. On average, the starting point was 20% below the peak and the valuation then fell back the same amount. The dashed bold line is Canadian price-to-income aligned to December 2011. The starting point was about 30% lower. We don’t know that December 2011 will be the peak because this method doesn’t necessarily help with timing. If we look at rents instead of incomes the picture is the same, except that for the current Canadian cycle, price-to-rent started 35% lower. Historically, the market cycles that went up more tended to fall more. The valuation ‘tents’ are roughly symmetric. For comparison, we highlight both the FHFA (Federal Housing and Finance Agency) and Case-Shiller versions of the US 2005 cycle (dots and dashes, Case-Shiller includes more “inexpensive properties with alternative financing”). Note that both follow the script.
Using a combination of price-to-rent and price-to-income, the straightforward conclusion is that Canadian housing needs to unwind about 30% from the current valuation ratios. That’s not the same thing as prices crashing by 30%! Importantly, if rents and incomes continue to go up, prices may not need to drop that much. In fact, annual growth in income and rents of 3% would deflate half of the valuation bubble over seven years. It is also conceivable that we don’t revert all the way back down. A modest price decline coupled with gains in rents and incomes is called a soft landing, exactly what the central bank and federal government is aiming for. However, watch out for weaker inflation or income gains, particularly as the economy adjusts to weaker housing activity.
It is possible that the market will force some price downside rather than patiently waiting seven years. Similarly, if inflation and incomes don’t grow, the soft landing idea stops working. This is what happened in the US. The US price-to-income charts fit the model, but they got there with more price drops and less wage inflation. We use this framework in our work to think about different scenarios and the implications for the economy and security valuations.
A housing bubble is hard to define, but like James Bond, we know it when we see it. We see it in Canada right now. But this doesn’t have to mean financial disaster is next. In fact, this research indicates that housing is almost always either inflating or deflating. It sure does matter for the economy, but for personal context, back to the Goldfinger movie. Bond turns to Moneypenny, “What do you know about gold?” “The only gold I know about is the kind you wear… you know, on the third finger of your left hand,” she replies, suggestively. Moneypenny understands, as do most Canadian homeowners: the gold on their fingers isn’t a retirement strategy and price changes needn’t make any difference at all.
Edited by: Marcela McBurney, CFA
This article is not intended to provide advice, recommendations or offers to buy or sell any product or service. The info provided in this article is compiled from our own research and is based on assumptions that we believe to be reasonable, accurate at the time the report was written, but, is subject to change without notice.
Recent Posts
- VIDEO: Navigating Dementia: Recognize, Prepare, Plan
- New Trust Reporting Requirements Now in Effect May Catch Some by Surprise
- Leith Wheeler Explainer Series: The Dividend Debate
- Hitting Pay Dirt: The Selling of an Ag Empire
- The Risks of Transactive Memory
- Building Out Your Core with US SMID and Emerging Markets Equities
- Resources for Reconciliation - 2023
- How Could Budget 2023’s Proposed Taxation of Donated Securities Affect Not-for-Profits?
- Taming an Unintentional Portfolio
- Women, Money, and My Holiday Beach Read