November 15, 2022 | Institutional Perspectives | 9 min read
David vs Goliath: The Case for Small/Mid-Cap US Equities
In the classic biblical tale, the relatively diminutive David faces off against Goliath, a giant among men. Against the odds, David triumphs, a victor y of dexterity and grit over lumbering brute strength. In US equity markets dominated by mega caps, there is a David lurking at the periphery. It’s worth a look.
Over the past decade, US equities have been a strong driving force behind balanced portfolio returns. Large capitalization (“large cap”) US equity stocks benefitted from a strong tailwind of record low interest rates and a market composition that weighted heavily towards technology. In Canadian dollar terms, the S&P 500 Index returned 15.6% per annum over the decade, more than double the return of Canadian and international equity markets.
With interest rates having normalized from near-zero levels, should investor s consider complementary strategies for their portfolios? In the US, we believe that an allocation to small/mid-cap equities (“SMID”) can enhance diversification benefits and participation in secular growth themes in this new economic environment. In the following sections we cover some historical and for ward-looking factors to consider.
A Role for US SMID Equities?
When the world shut down to prevent the spread of the virus in early 2020, businesses that could transition to work-from-home arrangements quickly did so. In our cocoons, we relied heavily on the services of technology and telecommunications companies for both work and leisure. While we perfected our Zoom/Microsoft Teams set up and burned through the Netflix catalogue, “FANMAG”1 stocks enjoyed a large, highly correlated pandemic tailwind through that summer. As Figure 1 shows, the result was a combined market weight for these companies of almost one-quarter of the entire S&P 500 Index – versus 17% prior and as little as 7% in 2013.
Figure 1: FANMAG stocks as a percentage of the overall S&P 500 Index, Jan 2015 – Oct 2022
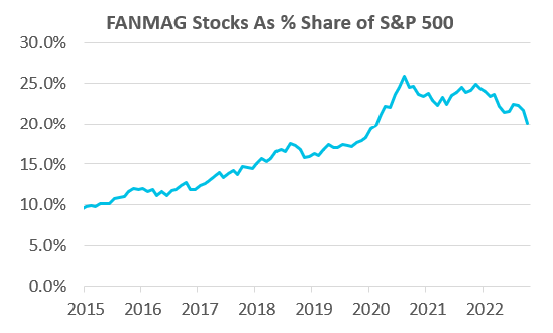
Even with the recent selloff in technology stocks, an investor today owning the S&P 500 Index still holds an almost 20% weight in this group of six technology stocks! In contrast, the Russell 2500 Index (benchmark for US SMID cap stocks) has a very low concentration. The top five holdings in the Russell 2500 Index only make up about 3% of the index2.
The SMID market also offers a broader set of companies with specialized product or services. Many companies focus in niche areas with less competition compared to the US large cap space. These companies often become attractive acquisition targets or receive a boost in valuation when a competitor is acquired. Smaller companies are more likely to generate their revenues domestically and be less impacted by currency and geopolitical risks, compared to larger companies which rely on international markets for growth.
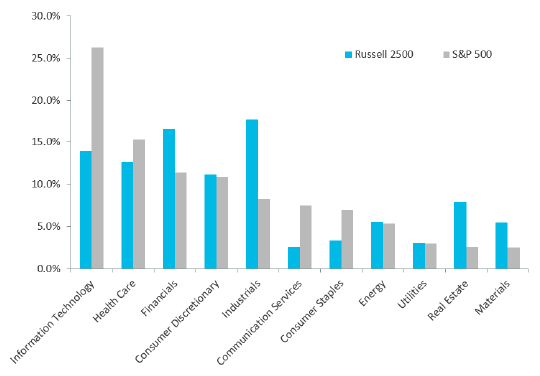
By sector, the broad SMID-cap market has a lower weighting in Information Technology and Communication Services and higher weighting in Financials, Industrials, Real Estate and Materials, relative to the S&P 500 Index.
Figure 2: Sector weights of Russell 2500 and S&P 500 Indices as of October 31, 2022
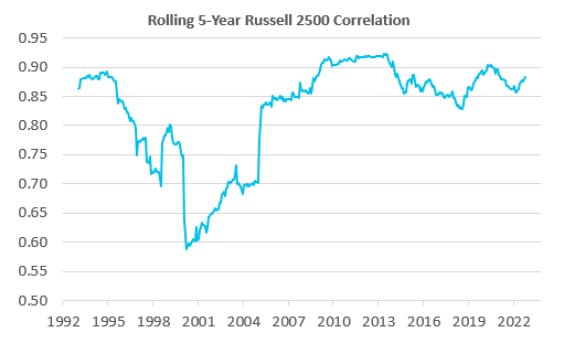
A larger investible universe allows active managers to become opportunistic at different points in the economic cycle. With the inclusion of SMID equity, the investible US universe increases by approximately 2,500 companies3. While investors of actively managed strategies may have concentrated portfolios compared to the index, the addition of US SMID equity to a US large cap equity strategy provides diversification from a business profile, sector, and opportunity standpoint. The rolling 5-year correlation between US large and SMID cap equities has averaged approximately 0.84 since 1999, providing diversification within the same geographical region.
Figure 3: Rolling 5-year correlation between the S&P 500 Index and the Russell 2500 Index
What About Value-Added Opportunities for Investment Managers?
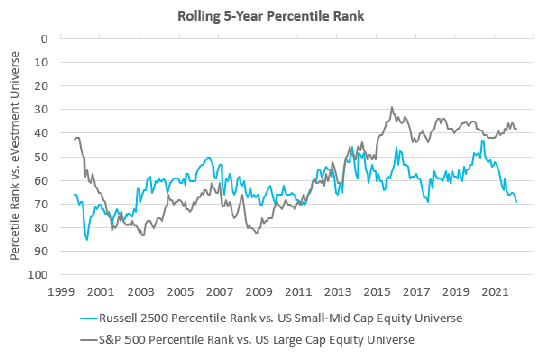
US SMID equity has historically been an area of the market where active managers have been able to add value on a more consistent basis. Since 1995, the index has consistently ranked below median, in the third quartile amongst active US SMID managers5 on a rolling 5-year return basis. This means that the average manager has been able to outperform the benchmark over that period.
In contrast, the S&P 500 Index has been a consistent second quartile performer over the past decade against actively managed large cap US equity strategies6, meaning that only a minority of managers are able to consistently beat the performance of the index. There were periods where the S&P 500 Index performed below median, but the growing dominance of FANMAG stocks has made it increasingly difficult for active managers to outperform7.
Figure 4: Index Percentile Ranking Compared to eVestment Universe
Exacerbating the challenge is the focus and high levels of research coverage for large cap stocks, with an average of 21 analysts covering S&P 500 stocks versus 8 for the Russell 2500. Lower levels of coverage for smaller cap companies increases opportunities for sharp-penciled managers to unearth mispriced stocks.
Looking Backwards and Forwards
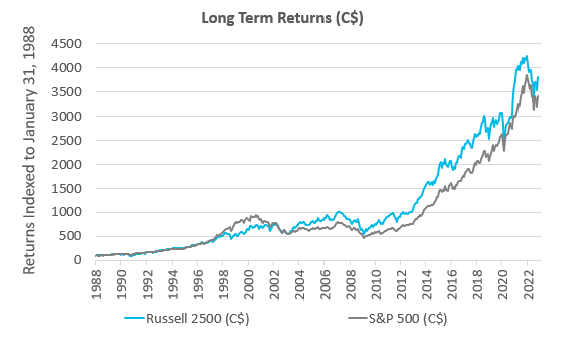
Historical absolute returns also favour US SMID. Over the past 30 years in Canadian dollar terms, the Russell 2500 Index has returned 10.5% per annum, outperforming the S&P 500 Index by over 0.5% each year on average. One reason is smaller companies are typically in a stage of their business where there are higher levels of revenue and earnings growth.
Figure 5: Returns of Russell 2500 and S&P 500 Indices (C$ and indexed to January 31, 1988)
As global central banks raise rates to combat inflation, one question to ask is: will smaller companies with less robust balance sheets struggle? Perhaps counterintuitive, history shows that US small cap companies have outperformed larger peers during these uncertain periods8. One reason is that the pricing power companies with niche products and services may command in an inflationary environment: as input costs and wages rise, these businesses pass these higher costs on to their customers. Higher interest rates also put significant pressure on the valuation of large growth stocks, as witnessed in technology and telecommunication sectors.
While economic conditions remain uncertain with risk of an economic recession on the horizon, earnings per share growth estimates for the Russell 2500 remain at 12% per annum9 over the next five years at current valuations.
How Does Leith Wheeler Invest in US SMID?
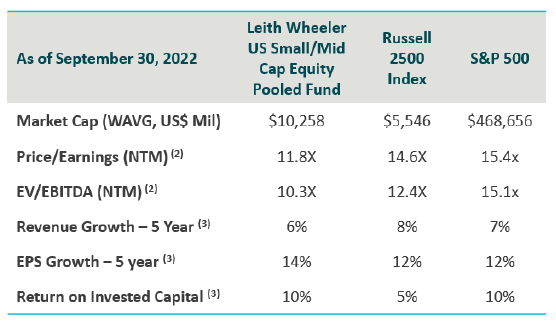
The Leith Wheeler US Small/Mid-Cap Equity Pooled Fund holds a concentrated portfolio of 20 to 40 small and mid-cap US companies. Our investment process assesses the risks of the business including barriers to entry, competition and industry dynamics, financial resilience, and company and industry-specific factors. Furthermore, we assess each stock’s fit within the overall portfolio in terms of relative attractiveness and correlative attributions to existing portfolio holdings. As bottom-up value investors, we invest in companies as if we own the entire company and construct our portfolios with a margin of safety built in through the initial price we pay. Our investment style typically results in a portfolio that trades at a valuation below the market10 with higher earnings and growth potential11. See Figure 6 for the Fund’s characteristics as of last quarter-end.
Figure 6: Leith Wheeler US Small-Mid Cap Equity Pooled Fund and Index Characteristics as of September 30, 2022
The third quarter marked the sixth year since the Leith Wheeler US Small/Mid-Cap Equity Pooled Fund was launched. By adhering to our bottom-up, value investment style, our US SMID strategy has been able invest in great businesses and outperform the Russell 2500 benchmark. Over this period, the Leith Wheeler US Small/Mid-Cap Equity Pooled Fund ranked solidly in the second quartile against the broad US Small-Mid Cap Equity Universe12 in terms of performance, Sharpe Ratio13 and Information Ratio14. When compared to only our Value peers, our fund has ranked in the 15th percentile for all three measures over six years, compared to the US Small/Mid-Cap Value Equity Universe15.
We believe US SMID equities could add important diversification and return benefits to US equity portfolios so if you’d like to discuss its possible fit in your portfolio, please reach out. In the battle for long-run, risk-adjusted returns, a well-aimed slingshot can make all the difference.
1“FANMAG” stocks represent a group made up of Meta (formerly Facebook), Amazon, Netflix, Microsoft, Apple and Alphabet (formerly Google).
2Source: FTSE Russell. As of October 31, 2022.
3Based on the Russell 2500 Index. We consider the investible universe of the Leith Wheeler Small/Mid-Cap Equity Fund to be closer to 3,000 companies.
4Source: Leith Wheeler, FTSE Russell, Standard & Poor’s.
5Total return of the Russell 2500 Index was measured against the US Small/Mid-Cap Equity Universe in eVestment.
6Total return of the S&P 500 Index was measured against the US Large-Cap Equity Universe in eVestment.
7Regarding the impact of survivorship bias on returns, both the US Small/Mid-Cap Equity Universe and US Large Cap Equity Universe in eVestment consistently gained constituents between 2000 and 2010. Since 2010, constituents for the US Small/Mid-Cap Equity Universe have held steady at around 200 to 225. In contrast, US Large-Cap Equity Universe constituents have fallen from 1,200 to 900 over the same period. This would indicate that survivorship bias has potentially a greater positive impact for the US Large Cap Equity Universe over the US Small/Mid-Cap Equity Universe.
8In a December 31, 2021 study by T. Rowe Price that covered 33 years, analysts found Russell 2000 stocks returned 15.9% in the year after 10-year Treasury yields started rising, vs 14.7% for the S&P 500. Their sources: Furey Research Partners, S&P, London Stock Exchange Group plc.
9Source: Leith Wheeler Investment Counsel estimates as of September 30, 2022.
10Standard valuation metrics such as Forward P/E (price to earnings) ratio and forward EV/EBIDTA (Enterprise Value to Earnings Before Interest, Debt, Taxes and Amortization) ratio. Weighted average forward looking multiple, excluding negative and large outliers of over 75x.
11Fund and index characteristics estimated using Bloomberg PORT and Bloomberg. Median estimates.
12Source: eVestment. The US Small-Mid Cap Equity Universe is made up of 195 funds managed in all investment styles.
13The Sharpe Ratio is calculated by subtracting the portfolio investment return by the return of a risk-free security (Canadian 3-month T-Bill) divided by the standard deviation of the portfolio investment return. The ratio describes the excess return received for an additional unit of risk expressed through the volatility of the portfolio.
14The Information Ratio is calculated by dividing the portfolio investment return excess of the benchmark return by the standard deviation of the excess return. A higher information ratio implies that an investment manager can achieve higher returns in excess of the benchmark and/or on a more consistent basis.
15Source: eVestment. The US Small-Mid Cap Value Equity Universe is made up of 70 funds.
IMPORTANT NOTE: This article is not intended to provide advice, recommendations or offers to buy or sell any product or service. The information provided is compiled from our own research that we believe to be reasonable and accurate at the time of writing, but is subject to change without notice. Forward looking statements are based on our assumptions, results could differ materially.
Reg. T.M., M.K. Leith Wheeler Investment Counsel Ltd. M.D., M.K. Leith Wheeler Investment Counsel Ltd. Registered, U.S. Patent and Trademark Office.